What people pay. Not what listings ask.

The listing tells you what the landlord wants. Rentnama shows what tenants report paying, building by building. A different starting point for the same big decision.
Visit rentnama.in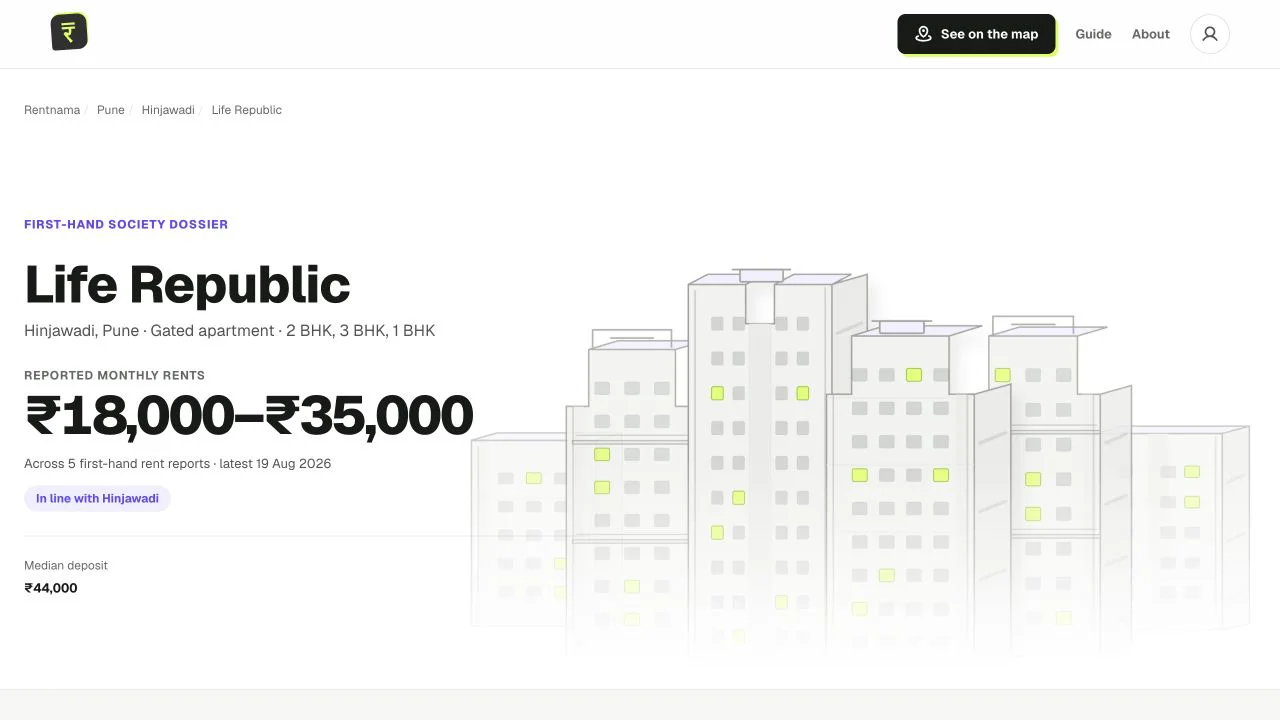
- Core job
- Society-level rent answers
- Delivery
- Strategy, design, web, data, operations
- Platform
- Cloudflare Workers + D1 + Google Maps
- Market focus
- Pune density; Mumbai and Bengaluru pilots
What if renters could see what people actually pay in the building they’re considering?
Screens and counts reflect the captured product. They show the experience and its evidence, not independently measured business results.
A rent answer with something behind it.
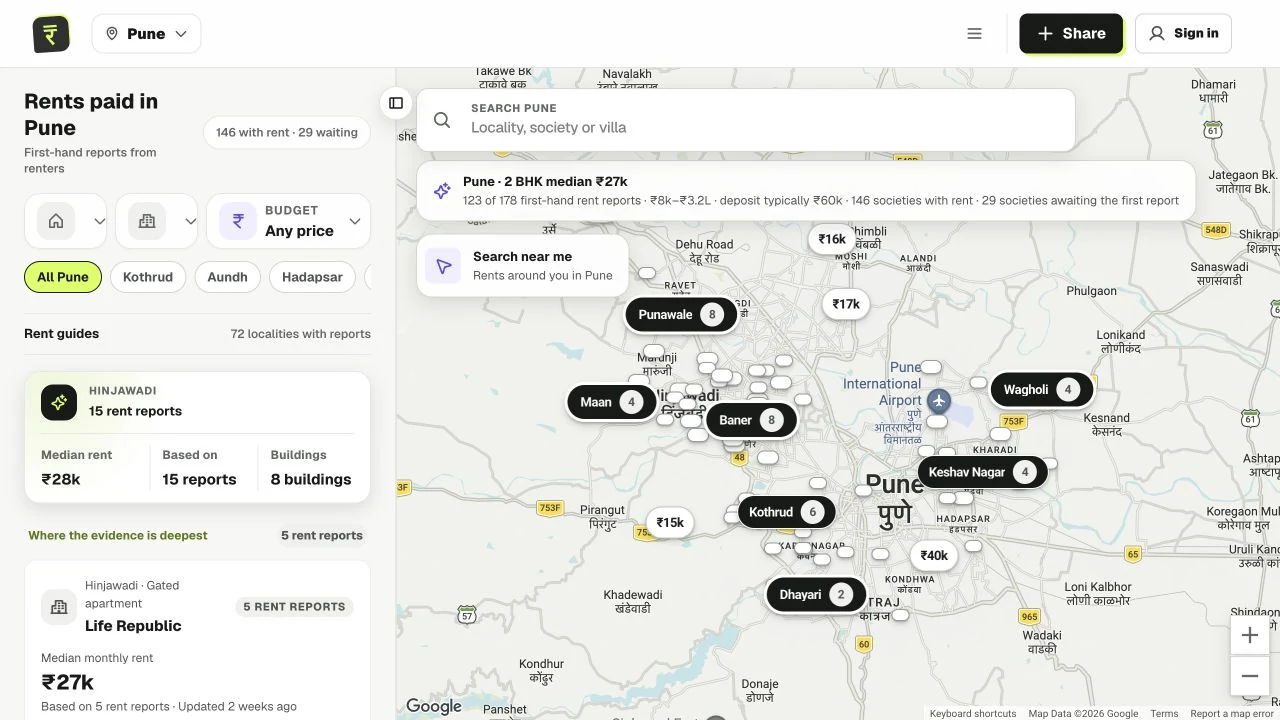
Search a building, see the reported rents and check how much evidence supports the answer. Compare nearby places or add your own rent without sharing your flat number.
- 178
- first-hand rent reports
- 146
- societies with rent evidence
- 72
- localities represented
- 5
- reports behind the featured society answer
Captured Pune product snapshot
Captured Pune product snapshot
Captured Pune product snapshot
Life Republic dossier
Every answer starts with someone’s rent.
A report belongs to a real place and a point in time. The interface shows how much is known, so a single report never looks like a market average.
- Home
- 2 BHK
- Deposit
- ₹44,000
Hinjawadi · Pune
Reported rent
A single contribution stays a single observed rent. It never becomes a fake market average.
Supported range
Multiple recent reports unlock an aggregate with count, freshness, and locality context attached.
Awaiting evidence
An empty society asks for the first contribution instead of displaying a confident-looking zero.
What needed a closer look.
Rental portals show asking prices. Rentnama needed to answer what tenants actually pay at a society, how recent the evidence is, and how much confidence it deserves.
Some buildings have plenty of reports; others have one or none. The design needs to make that difference obvious while protecting the people who contribute.
The choices behind the product.
What needed attention, how the product handles it, and why that matters to the person using it.
Start with the building, not the whole city.
- The problem
- A city-wide rent average says little about the building someone is considering.
- The choice
- Let people search for a society or locality and see the reports for that place.
- Why it matters
- The answer stays close to the decision the renter is trying to make.
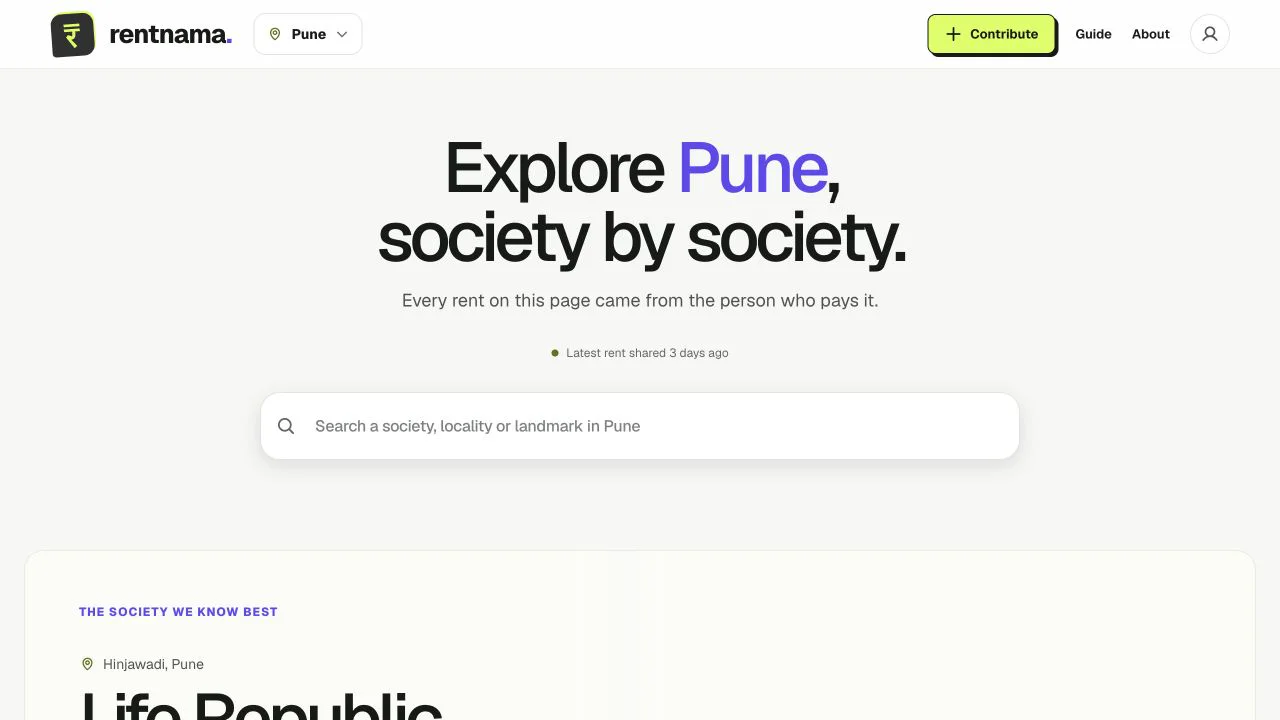
Live product // Search to society answer Say exactly what the evidence can support.
- The problem
- Thin data could look as authoritative as deep data.
- The choice
- One report stays one report; aggregates require enough evidence, count, and freshness.
- Why it matters
- People can see what is known, what is not, and why.
Make sharing useful without making it invasive.
- The problem
- Free-text submissions could attach rent to the wrong building or collect invasive details.
- The choice
- Reuse known building names and confirm new places on the map. Never ask for a flat number.
- Why it matters
- A report can help the next renter without exposing someone’s exact home.
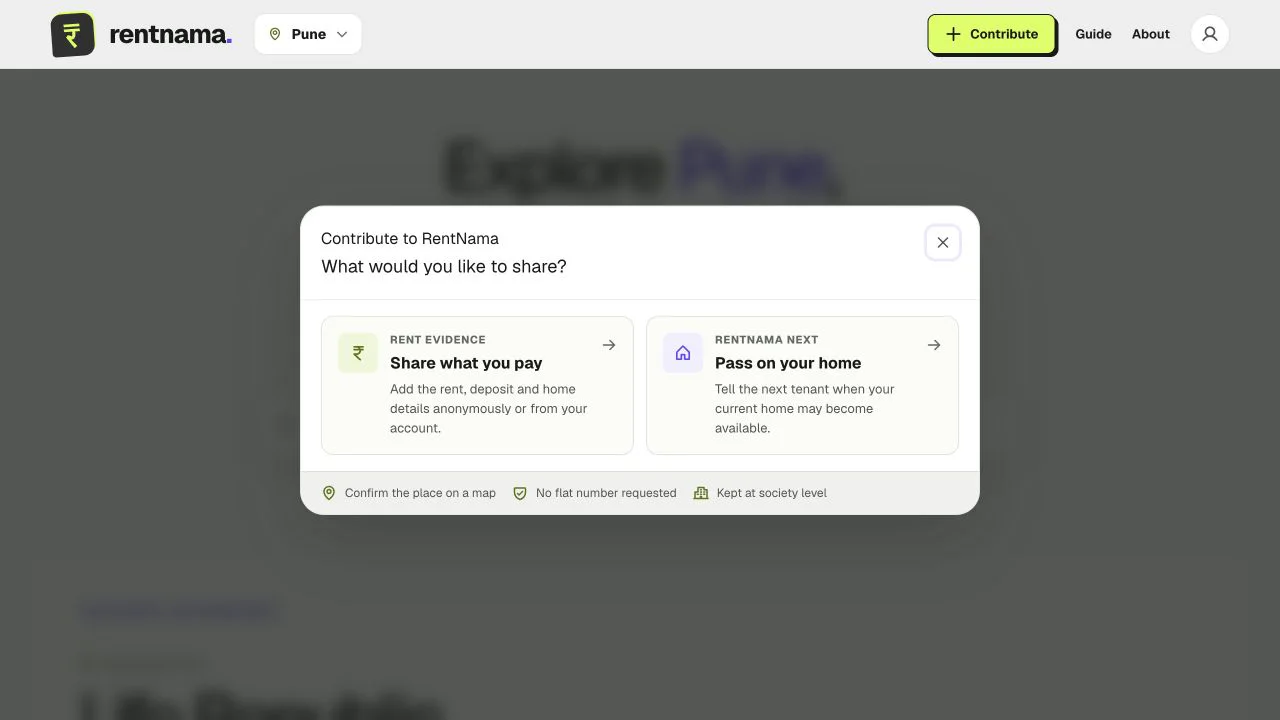
Live product // Privacy-bounded contribution Give people a reason to come back and contribute.
- The problem
- Reading an answer does not automatically lead to another report.
- The choice
- Let people share an answer, watch a building and contribute their own experience.
- Why it matters
- The product offers ways to stay involved as the information changes.
What went into it.
- Society and locality search with stable place identity
- Evidence-bounded rent aggregation and answer states
- Map exploration and guided-precision contribution
- Purpose-specific sharing and building watches
- Privacy-safe product analytics and data governance
- Moderation, density operations, and native-readiness gates
The live product and implementation verify the flows, evidence rules, privacy boundaries, and operating tools described here. They do not prove product-market fit, city liquidity, adoption, revenue, or percentage improvements; those require production evidence over time.
Give us something to think about.
The product you want to exist. The problem you can’t leave alone. Start there.